Ocala Insurance

Insurance in Ocala

Call Today: (352) 732-7105

  • Request a Certificate
  • Personal Insurance
    • Homeowners Insurance
    • Car Insurance
    • Umbrella Insurance
    • Flood Insurance
  • Business Insurance
  • Farm Insurance
  • About Us
  • Payments
  • Claims
  • Contact Us

Hurricane Deductible Information

June 18, 2018 By Anna Brantley

Courtesy of iii.org

The official Atlantic hurricane season runs from June through November, but occasionally storms form outside those months. September is the most common month for hurricanes making landfall in the U.S., followed by August and October, according to an analysis of 1851 to 2015 data by the National Oceanic and Atmospheric Administration. No hurricanes made U.S. landfall before June and after November during the period studied.

2018 Hurricane Forecast: Dr. Philip Klotzbach and Michael Bell of Colorado State University (CSU) released an updated forecast for the 2018 Atlantic hurricane season at the end of May. The CSU team now envisions a near-average season with 14 named storms, six hurricanes, and two major hurricanes. The May forecast is slightly lower than their original outlook which called for 14 named storms, seven hurricanes, and three major hurricanes. A typical year has 12 named storms, six hurricanes, and three major hurricanes, according to the National Oceanic and Atmospheric Administration (NOAA). Major hurricanes (Category 3 or higher) have sustained wind speeds of at least 111 miles per hour.

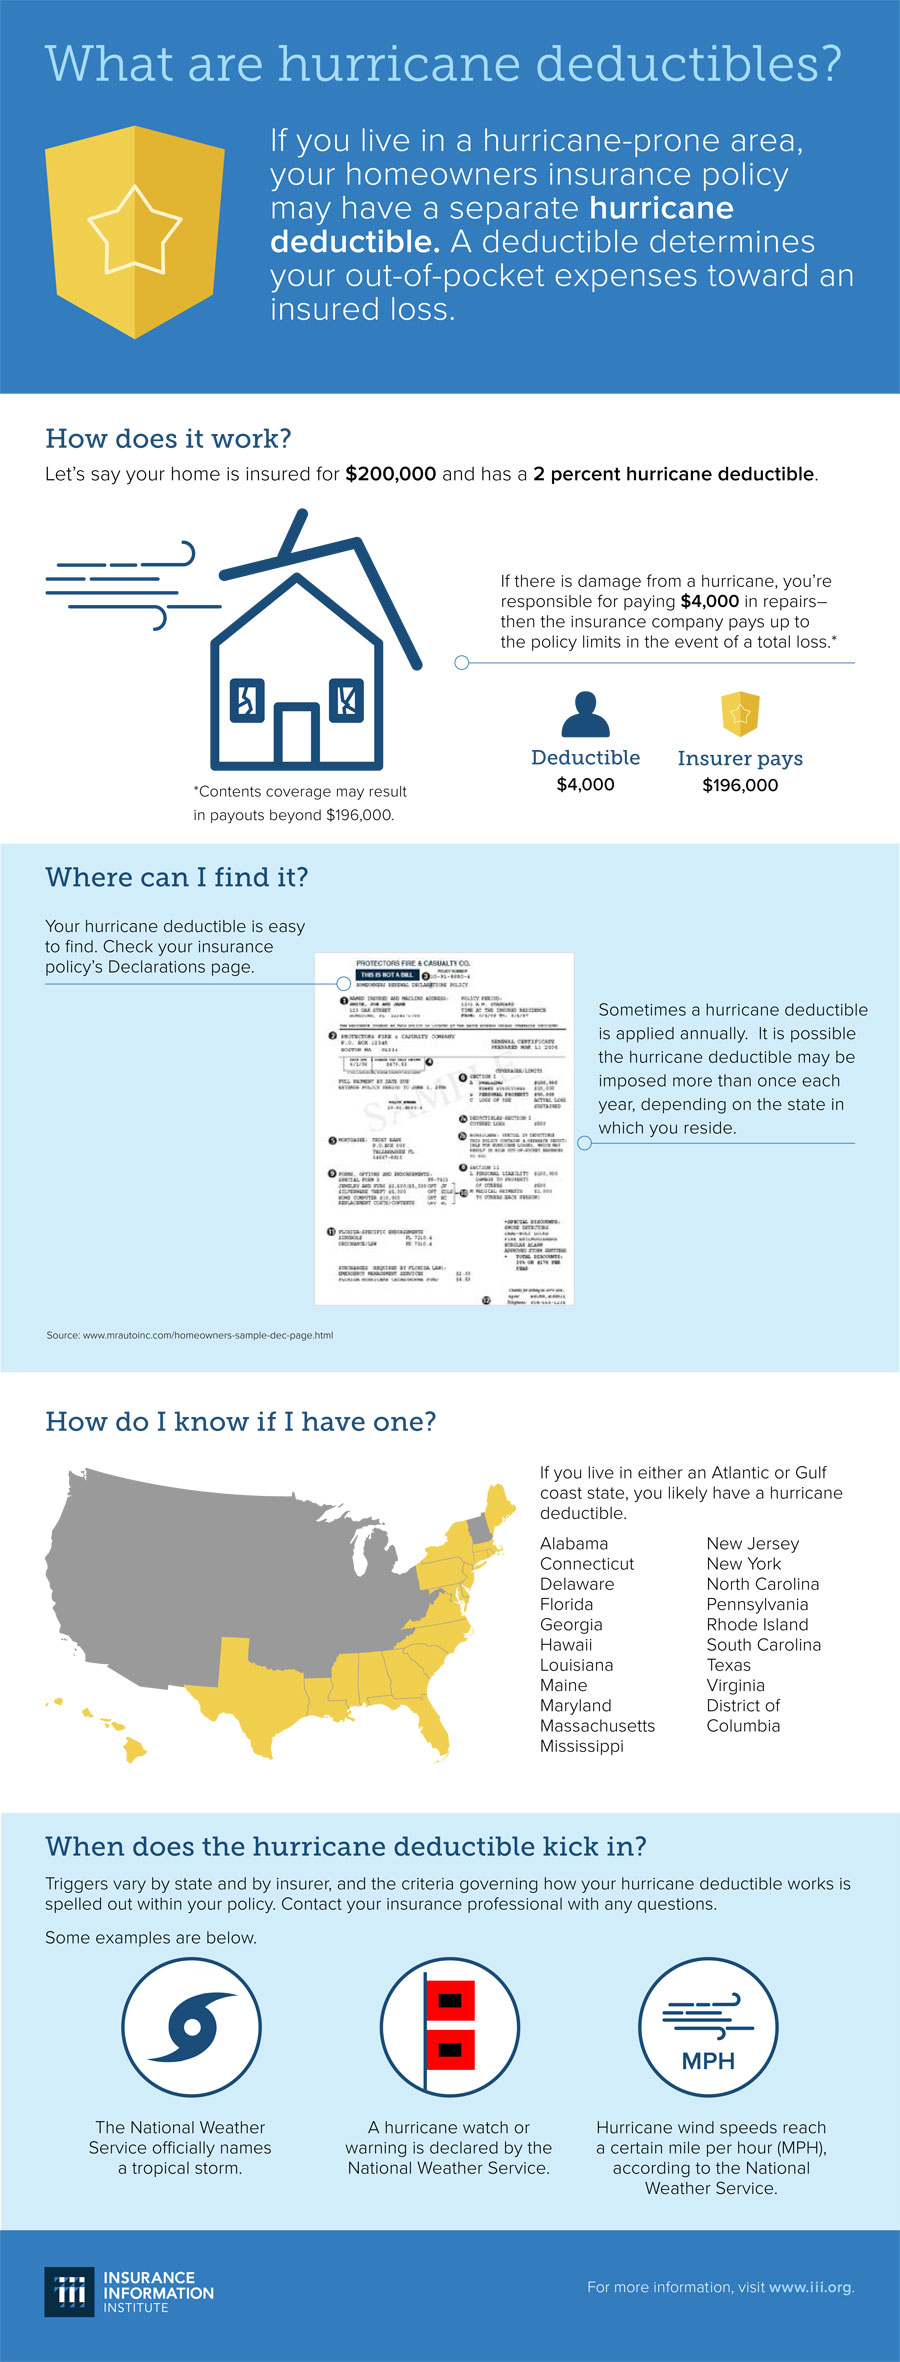
What is a Hurricane Deductible?

Filed Under: Insurance News, News

2018 Atlantic Hurricane Forecast

June 3, 2018 By Anna Brantley

Courtesy of iii.org

On Thursday April 5th Philip J. Klotzbach and Michael M. Bell, scientists with the Colorado State University, issued their 2018 Atlantic Hurricane Forecast. The forecast anticipates slightly above-average activity for the 2018 Atlantic basin hurricane season.

There is slightly above-average probability of a major hurricanes making landfall along the continental United States coastline and in the Caribbean.

Klotzbach and Bell estimate that 2018 will have 7 hurricanes (median is 6.5), 14 named storms (median is 12.0), 70 named storm days (median is 60.1), 30 hurricane days (median is 21.3), 3 major (Category 3-4-5) hurricane (median is 2.0) and 7 major hurricane days (median is 3.9). The probability of U.S. major hurricane landfall is estimated to be about 120 percent of the long-period average.

Probabilities for at least one major hurricane landfall on each of the following coastal areas:

  • Entire continental U.S. coastline – 63% (average for last century is 52%)
  • U.S. East Coast Including Peninsula Florida – 39% (average for last century is 31%)
  • Gulf Coast from the Florida Panhandle westward to Brownsville – 38% (average for last century is 30%)

As is the case with all hurricane seasons, coastal residents are reminded that it only takes one hurricane making landfall to make it an active season for them. They should prepare the same for every season, regardless of how much activity is predicted.

Click here for the full forecast.

Dr. Philip Klotzbach is a non-resident scholar for the Insurance Information Institute (I.I.I.)

Filed Under: News

School & Sports Safety

March 25, 2018 By Anna Brantley

Courtesy of iii.org

Young people aged 5 to 14 accounted for 51 percent of the football injuries treated in emergency rooms in 2015, according to data from the National Safety Council. This age group accounted for 79 percent of gymnastics injuries, 51 percent of baseball and 40 percent of track and field injuries treated in emergency rooms the same year. (see chart below).

Bicycle crashes

Bicyclist fatalities had been declining steadily since 1975, and fell to a record low of 621 in 2010, according to a report issued by the Governors Highway Safety Association. By 2015, Bicyclist fatalities were up 12.2 percent to 818 compared with 2014. The report, which was compiled with funding from State Farm Insurance, notes that bicyclists have consistently accounted for at least 2 percent of all traffic fatalities, which rose 7.2 percent in 2015. The average age of bicyclists killed in traffic crashes was 45 years old in 2014 and 2015, up from 42 in 2010 and 39 in 2005, based on data from the Fatal Accident Reporting System at the National Highway Traffic Safety Administration. Through 1989, teens between the ages of 16 and 20 had accounted for the greatest number of bicyclist traffic deaths. Eighty-five percent of bicyclist deaths were among males compared with 15 percent for women in 2015. The proportions for injuries were 80 percent for males and 20 percent for females. Warm-weather, large population states had the highest numbers of bicyclist deaths. The GHSA says that Florida, California and Texas accounted for 40 percent of all bicyclist deaths in 2015.

Biking is the third most dangerous sport after basketball, based on estimates of injuries treated in hospital emergency departments compiled by the National Safety Council. In 2015, 488,123 people were treated for injuries sustained while riding bicycles. According to the Breakaway Research Group, 34 percent of Americans, or 103.7 million people between the ages of 3 and older, rode bicycles in 2015. Bicycles are increasingly being used for more than recreation. The percentage of adults who biked to work grew from 0.4 percent in 2005 to 0.6 percent in 2013, according to the Alliance for Biking and Walking. Large cities saw the largest increases in biking to work: the percentage increased from 0.7 percent to 1.2 percent from 2005 to 2013.The FBI reports that 180,123 bicycles were stolen in 2015, down 0.2 percent from 2014. The average value of a stolen bicycle was $444 in 2015.

The report also found that lack of helmet use and alcohol impairment continue to be major contributing factors in bicyclist deaths. In 2012 data from the National Highway Traffic Safety Administration indicate that 17 percent of fatally injured bicyclists were wearing helmets, 65 percent were not and helmet use was unknown for the remaining 18 percent. A large number of fatally injured bicyclists had blood alcohol concentration (BAC) of 0.08 percent or higher, the legal definition of alcohol-impaired driving, including 28 percent of those aged 16 and older. The percentage of bicyclists with high BACs ranged from 23 percent to 33 percent during the period 1982 to 2012.

Sports injuries

Basketball was the most dangerous sport in 2014, with 522,817 injuries reported followed by biking, with 502,104 injuries and football, with 396,457 injuries.

The National Safety Council reports that there were 179,188 swimming injuries treated in emergency rooms in 2014. About 42 percent of the injuries involved children between the ages of five and 14. A report by the Consumer Product Safety Commission found that 174 children between the ages of one and 14 drowned from Memorial Day to Labor Day in 2014. There has been growing concern about the risks of sports-related concussions as lawsuits filed by injured professional football players have generated national headlines. The problem also affects thousands of young people who engage in a variety of sports. The Centers for Disease Control and Prevention reports that in 2009, an estimated 248,418 children (age 19 or younger) were treated in U.S. emergency departments for sports and recreation-related injuries that included a diagnosis of concussion or traumatic brain injury.

Watercraft accidents

Federal law requires owners of recreational boats and watercraft (non-commercial) to register them. In 2016 there were 11.9 million registered recreational watercraft, about the same number as in 2015. A recreational boating accident must be reported to the U.S. Coast Guard if a person dies or is injured and requires medical treatment beyond first aid; if damage to the boat or other property exceeds $2,000; if the boat is lost or if a person disappears from the boat. Out of the 4,463 accidents reported in 2016, 684 occurred in Florida. Other states with a high number of accidents were California (386), New York (188), Texas (176) and Maryland (150).

Fatalities increased by 12.0 percent to 701 in 2016 from 626 in 2015. The rate per 100,000 registered watercraft was 5.9, up from 5.3 in 2015. The number of accidents rose in 2016 to 4,463 from 4,158 in 2015, up 7.3 percent. Injuries rose to 2,903 in 2016 from 2,613 in 2015, or 11.1 percent. Property damage totaled $49 million in 2016, up from $42 million in 2015.

The U.S. Coast Guard says that alcohol, combined with typical conditions such as motion, vibration, engine noise, sun, wind and spray can impair a person’s abilities much faster than alcohol consumption on land. Operators with a blood alcohol concentration (BAC) above 0.10 percent are estimated to be more than 10 times more likely to be killed in an accident than watercraft operators with zero BAC. Alcohol was a contributing factor in 350 recreational watercraft accidents in 2016 (7.8 percent of all accidents), accounting for 133 deaths (19.0 percent of all deaths) and 335 injuries (11.5 percent of all injuries). Other primary contributing factors were operator inexperience, resulting in 62 deaths; and operator inattention accounting for 45 deaths.


Filed Under: News, Uncategorized

Wildfire Risk & Florida

March 18, 2018 By Anna Brantley

of iii.org

Fire plays an important role in the life of a forest, clearing away dead wood and undergrowth to make way for younger trees but the risk wildfires pose to people and property is growing as more people move into forested areas once largely uninhabited. These areas, known as the Wildland-Urban Interface (WUI), contain about 44 million houses in the lower 48 states, according to the U.S. Forest Service.

Rising temperatures are also believed to contribute to large, destructive blazes. Warmer weather contributes to wildfire conditions in several ways: dryer and more combustible vegetation, more frequent lightning strikes, an extended fire season; and more intense winds.

Harvard School of Engineering and Applied Sciences researchers have concluded that by 2050 the number of wildfires in the West could rise by 50 percent, and across the U.S. the number would double.

Insured wildfire losses

Damage caused by fire and smoke are covered under standard homeowners, renters and business owners insurance policies and under the comprehensive portion of an auto insurance policy. Water or other damage caused by fire fighters to extinguish the fire is also covered under these policies. In California, the California FAIR Plan covers residential and commercial properties located in brush and wildfire areas. Properties in those areas are subject to higher rates due to increased risk of fire.

Causes of wildfires

As many as 90 percent of wildland fires in the United States are caused by humans, according to the U.S. Department of Interior. Some human-caused fires result from campfires left unattended, the burning of debris, negligently discarded cigarettes and intentional acts of arson. The remaining 10 percent are started by lightning or lava.

Wildfire prevention and mitigation

Researchers are discovering that embers blown by the wind during wildfires cause most of the fires that burn homes. Also, homes that are less than 15 feet apart are more likely to burn in clusters. In such cases, fire is often spread by combustible fences and decks connected to houses, a study by the Insurance Institute for Business & Home Safety (IBHS) found.

Among the preventive features recommended in the IBHS study were noncombustible siding, decking and roofing materials; covered vents; and fences not connected directly to the house. In addition, combustible structures in the yard such as playground equipment should be at least 30 feet away from the house and vegetation 100 feet away.

Properties at risk for wildfires

According to Verisk’s 2017 Wildfire Risk Analysis 4.5 million U.S. homes were identified at high or extreme risk of wildfire, with more than 2 million in California alone.

Charts and graphs

Total Potential Exposure To Wildfire Damage By Risk Category, 2014 (1)

($ billions)

State Low Moderate High Very high
Arizona $9.64 $0.98 $1.76 $1.57
California 75.84 61.92 89.35 16.10
Colorado 18.63 11.53 14.58 13.91
Idaho 9.20 5.56 3.71 2.62
Montana 14.63 4.43 2.29 2.40
Nevada 4.24 5.19 4.57 0.16
New Mexico 11.65 4.62 7.07 2.46
Oklahoma 31.92 16.77 0.03 0.00
Oregon 8.24 9.49 11.91 3.20
Texas 59.53 147.68 48.26 6.33
Utah 2.85 3.93 0.77 0.01
Washington 84.07 18.08 2.88 0.51
Wyoming 3.68 2.62 0.49 0.33
Total, states shown $331.27 $292.81 $187.66 $49.61

(1) Reconstruction value of single-family residences at risk.

Source: CoreLogic, Inc., a data and analytics company.

View Archived Tables

Top 10 Most Wildfire Prone States, 2017

By households By percent
of households
Rank State Households at high
or extreme risk
from wildfires (1)
Rank State Percent of households
at high or extreme
risk from wildfires
1 California 2,044,800 1 Montana 28%
2 Texas 715,300 2 Idaho 26
3 Colorado 366,200 3 Colorado 17
4 Arizona 234,600 4 California 15
5 Idaho 171,200 5 New Mexico 14
6 Washington 154,900 6 Utah 14
7 Oklahoma 152,900 7 Wyoming 14
8 Oregon 148,800 8 Oklahoma 9
9 Utah 133,100 9 Oregon 9
10 Montana 133,000 10 Arizona 8

(1) Number of households is based on data from the 2010 U.S. Census.

Source: Verisk Insurance Solutions – Underwriting and Verisk Climate units of Verisk Analytics®.

View Archived Tables

Wildfire Losses In The United States, 2007-2016 (1)

(2016 $ millions)

wildfire_loss_in_the_us_07-16.gif

(1) Adjusted for inflation by Munich Re based on the Consumer Price Index.

Source: © 2017 Munich Re, Geo Risks Research, NatCatSERVICE.

View Archived Graphs

Natural Catastrophe Losses In The United States, 2015 (1)

($ millions)

Event Number of relevant events (2) Fatalities Overall losses Insured losses (3)
Severe thunderstorm 37 114 $13,400 $9,600
Winter storms and cold waves 11 98 4,700 3,500
Flood, flash flood 12 86 3,800 1,100
Earthquake and geophysical 0 0 minor minor
Tropical cyclone 2 5 100 60
Wildfire, heat waves and drought 19 14 4,400 1,900
Other 4 7 minor minor
Total 85 324 $26,400 $16,100

(1) As of February 2016.
(2) Events that have caused at least one fatality or losses of $3 million or more.
(3) Based on property losses including, if applicable, agricultural, offshore, marine, aviation and National Flood Insurance Program losses and may differ from data shown elsewhere.

Source: Munich Re NatCatSERVICE; Property Claim Services®, a unit of ISO®, a Verisk Analytics® business. © 2016 Munich Re, NatCatSERVICE.

View Archived Tables

Top 10 States For Wildfires Ranked By Number Of Fires And By Number Of Acres Burned, 2016

Rank State Number of fires Rank State Number of acres burned
1 Texas 9,300 1 Oklahoma 767,780
2 California 7,349 2 California 560,815
3 Georgia 5,086 3 Alaska 496,467
4 North Carolina 4,007 4 Idaho 361,649
5 Alabama 3,923 5 Texas 356,680
6 Florida 3,067 6 Kansas 349,829
7 Missouri 2,610 7 Arizona 308,245
8 Arizona 2,288 8 Washington 293,717
9 Tennessee 2,165 9 Nevada 265,156
10 Montana 2,026 10 Oregon 219,509

Source: National Interagency Fire Center.

View Archived Tables

Top 10 Costliest Wildland Fires In The United States (1)

($ millions)

Estimated insured loss
Rank Date Name, Location Dollars when occurred In 2016 dollars (2)
1 Oct. 20-21, 1991 Oakland Hills Fire, CA $1,700 $2,746
2 Oct. 21-24, 2007 Witch Fire, CA 1,300 1,488
3 Oct. 25-Nov. 4, 2003 Cedar Fire, CA 1,060 1,362
4 Oct. 25-Nov. 3, 2003 Old Fire, CA 975 1,253
5 Nov. 28-30, 2016 Great Smoky Mountains Fire, TN 938 938
6 Sep. 12-14, 2015 Valley Fire, CA 921 933
7 Nov. 2-3, 1993 Topanga Fire, CA 375 578
8 Sep. 4-9, 2011 Bastrop County Complex Fire, TX 530 572
9 Oct. 27-28, 1993 Laguna Canyon Fire, CA 350 540
10 Jun. 24-28, 2012 Waldo Canyon Fire, CO 450 477

(1) Property coverage only for catastrophic fires. Effective January 1, 1997, ISO’s Property Claim Services (PCS) unit defines catastrophes as events that cause more than $25 million in insured property damage and that affect a significant number of insureds and insurers. From 1982 to 1996, PCS used a $5 million threshold in defining catastrophes. Before 1982, PCS used a $1 million threshold. Does not include wildfires in 2017.
(2) Adjusted for inflation through 2016 by ISO using the GDP implicit price deflator.

Source: The Property Claim Services® (PCS®) unit of ISO®, a Verisk Analytics® company

Filed Under: News

Cyberattack & Small Business Risk

March 11, 2018 By Anna Brantley

Courtesy of iii.org
More than half of U.S. small- and medium-sized businesses (SMBs) experienced a cyberattack within the past year, yet only 14 percent of businesses felt prepared and protected, according to a recent white paper from the Insurance Information Institute (I.I.I.).

The white paper, Protecting Against #Cyberfail: Small Business and Cyber Insurance, examines how insurers are addressing the threat cyberattacks and data breaches pose to SMBs through a combination of innovative insurance products, risk management techniques and employee training.

“Insurers foresee substantial growth coming from the SMB segment, as these companies become aware of the possibilities of liability, especially a breach and resulting response costs arising out of the possession of private data,” said Sean Kevelighan, chief executive officer, I.I.I.

The vast majority of cyber insurance claims involved the loss, exposure, or misuse of sensitive personal data. About half (48 percent) of the data breaches of U.S. small businesses in 2016 were caused by either a negligent employee or contractor, according to the Ponemon Institute.
U.S. insurers reported collecting $1.35 billion in direct premiums written for cyber insurance in 2016, according to the National Association of Insurance Commissioners. Stand-alone cyber insurance policies accounted for $921 million of that total (68 percent), while the balance came primarily from endorsements on either a small commercial or businessowners policy (BOP).

Typical cyber-related policies cover the costs arising from either a cyberattack or a data breach, such as responding to lawsuits, repairing damaged infrastructure, and paying the ‘ransom’ demanded by cyber extortionists, among other potential exposures, such as business interruption expenses.

“Creating an affordable product that SMBs will be willing to buy is a key component in the insurance offering. Since different industry sectors represent different levels of exposure, pricing will vary depending on the type of SMB,” the white paper, co-authored by James Lynch, the I.I.I.’s chief actuary, and the I.I.I.’s Claire Wilkinson, a consultant, states.

The I.I.I. has a full library of educational videos on its YouTube Channel.

Filed Under: News, Uncategorized

  • « Previous Page
  • 1
  • 2
  • 3
  • 4
  • 5
  • …
  • 11
  • Next Page »

The Griffin Insurance Agency
2139 NE 2nd Street
Ocala, FL 34470

Phone: (352) 732-7105
Fax: (352) 732-9705
Hours: Monday-Friday: 9-5

  • Request a Certificate
  • Payments
  • Claims
  • Insurance Blog
  • Contact Us
  • Home
  • Privacy Policy

Copyright Grffin Insurance Agency 2015 · designed by iWebResults