Ocala Insurance

Insurance in Ocala

Call Today: (352) 732-7105

  • Request a Certificate
  • Personal Insurance
    • Homeowners Insurance
    • Car Insurance
    • Umbrella Insurance
    • Flood Insurance
  • Business Insurance
  • Farm Insurance
  • About Us
  • Payments
  • Claims
  • Contact Us

Wildfire Preventive Measures

November 3, 2019 By Anna Brantley

Courtesy of iii.org

Facts about wildfire risk

The deadly destruction of a wildfire is not to be underestimated. Hard to contain, wildfires consume everything in their wake and wreak havoc on lives, landscapes and homes. Wildfires:

  • Occur in 38 states – California is the state most associated with wildfires and, in fact, eight of the 10 most costly wildfires in the U.S. have occurred there. That said, Texas has been known to have twice the wildfires as California in a given year and 38 of U.S. states have areas at risk.
  • Like dry conditions – Drought conditions, dry undergrowth and the presence of combustible and flammable materials contribute to wildfire hazard.
  • Are more dangerous in combination with development – The risk of damage increases as housing and business development expands into the wildfire-prone wildland-urban interface (WUI)—such as mountain, foothill or grassland areas.
  • Spread mostly on the wind – Direct flame contact and radiant heat from a wildfire can ignite combustible materials. However, research has shown that homes burned during wildfires most frequently catch fire from live embers (or “firebrands”) that are blown by the wind.
  • Thrive on house “togetherness” – Because of the dangers of the embers, close proximity of homes and presence of combustible features both increase the chances of a home going up in flames. Fire spreads rapidly when homes are less than 15 feet apart, making homes that are clustered near others more likely to burn. Features like fences and attached decks made from combustible materials often hasten the spread of fire.

Wildfire preventative building features

Wildfires need fuel to spread—like wood, plastic, wood-plastic products and foliage. Don’t help your house feed the flames—fit or retrofit your home with features that deter fire. The Insurance Institute for Business & Home Safety (IBHS) and others have this advice:

  • Maintain five feet of non-combustible “defensible space” around your home – Keep a five-foot diameter space of gravel, brick, or concrete in the area adjacent to your home.
  • Maintain an expanded “defensible space” between five and 30 feet from your home – Keeping this area as unattractive to wildfires as possible will reduce the risk. Move trailers/RVs and storage sheds from area, or build defensible space (see above) around these items. Remove shrubs under trees, prune branches that overhang your roof, thin trees, and remove dead vegetation.
  • Use non-combustible siding – and maintain a six-inch ground-to-siding clearance
  • Regularly clean from your roof and gutters – to keep debris from being ignited by wind-blown embers. Use noncombustible gutter covers.
  • Get a Class A fire-rated roof – Class A roofing products offer the best protection for homes.
  • Use non-combustible fences and gates – Burning fencing can generate embers and cause direct flame contact to your home.
  • Cover vents and create soffited eaves – Use 1/8-inch mesh to cover vents, and box-in (create soffits) on open eaves to keep embers out.
  • Use multi-pane, tempered glass windows – Close windows when a wildfire threatens.
  • Fireproof the deck – At a minimum, use deck boards that comply with California requirements for new construction in wildfire-prone areas. Remove combustibles from under deck, and maintain effective defensible space around the deck.
  • Keep combustibles far away from the house – Combustible structures in the yard such as wood, plastic or plastic-wood playground equipment should be at least 30 feet away from the house. Experts indicate that evergreen trees, palms and eucalyptus trees have more combustible qualities than others—keep this type of vegetation 100 feet away from the house.

Filed Under: Uncategorized

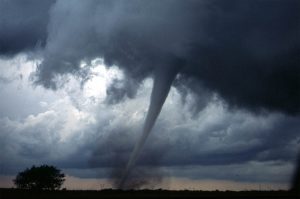
Tornado Dangers

July 8, 2018 By Anna Brantley

Courtesy of iii.org

Warnings/watches

Remember that a watch means that weather conditions are favorable for tornadoes and a warning means one has been spotted in your area.

  • Learn the warning signals used in your community. If a siren sounds, that means stay inside and take cover.
  • Consider setting up a neighborhood information program through a club, church group or community group. Hold briefings on safety procedures as tornado season approaches. Set up a system to make sure senior citizens and shut-ins are alerted if there is a tornado warning.

Seeking shelter

Do not try to outrun a tornado. Instead, stay calm and seek shelter.

  • At home or work, seek shelter in the central part of the building, away from windows. Basements are the best havens. If this is not an option, take cover in the bathroom, closet, interior hallway or under a heavy piece of furniture.
  • If you are in your car, abandon your vehicle and seek shelter in the nearest ditch if no other facility is available.
  • People living in mobile homes should vacate the premises and seek shelter elsewhere.

Protecting your property

  • If a tornado watch has been issued, move cars inside a garage or carport to avoid damage from hail that often accompanies tornadoes. Keep your car keys and house keys with you.
  • If time permits, move lawn furniture and yard equipment such as lawnmowers inside. Otherwise they could become damaged or act as dangerous projectiles causing serious injury or damage.
  • Make an inventory of your possessions and store it off the premises. If your belongings are damaged, this list will help facilitate the claim filing process.

Filed Under: News, Uncategorized

School & Sports Safety

March 25, 2018 By Anna Brantley

Courtesy of iii.org

Young people aged 5 to 14 accounted for 51 percent of the football injuries treated in emergency rooms in 2015, according to data from the National Safety Council. This age group accounted for 79 percent of gymnastics injuries, 51 percent of baseball and 40 percent of track and field injuries treated in emergency rooms the same year. (see chart below).

Bicycle crashes

Bicyclist fatalities had been declining steadily since 1975, and fell to a record low of 621 in 2010, according to a report issued by the Governors Highway Safety Association. By 2015, Bicyclist fatalities were up 12.2 percent to 818 compared with 2014. The report, which was compiled with funding from State Farm Insurance, notes that bicyclists have consistently accounted for at least 2 percent of all traffic fatalities, which rose 7.2 percent in 2015. The average age of bicyclists killed in traffic crashes was 45 years old in 2014 and 2015, up from 42 in 2010 and 39 in 2005, based on data from the Fatal Accident Reporting System at the National Highway Traffic Safety Administration. Through 1989, teens between the ages of 16 and 20 had accounted for the greatest number of bicyclist traffic deaths. Eighty-five percent of bicyclist deaths were among males compared with 15 percent for women in 2015. The proportions for injuries were 80 percent for males and 20 percent for females. Warm-weather, large population states had the highest numbers of bicyclist deaths. The GHSA says that Florida, California and Texas accounted for 40 percent of all bicyclist deaths in 2015.

Biking is the third most dangerous sport after basketball, based on estimates of injuries treated in hospital emergency departments compiled by the National Safety Council. In 2015, 488,123 people were treated for injuries sustained while riding bicycles. According to the Breakaway Research Group, 34 percent of Americans, or 103.7 million people between the ages of 3 and older, rode bicycles in 2015. Bicycles are increasingly being used for more than recreation. The percentage of adults who biked to work grew from 0.4 percent in 2005 to 0.6 percent in 2013, according to the Alliance for Biking and Walking. Large cities saw the largest increases in biking to work: the percentage increased from 0.7 percent to 1.2 percent from 2005 to 2013.The FBI reports that 180,123 bicycles were stolen in 2015, down 0.2 percent from 2014. The average value of a stolen bicycle was $444 in 2015.

The report also found that lack of helmet use and alcohol impairment continue to be major contributing factors in bicyclist deaths. In 2012 data from the National Highway Traffic Safety Administration indicate that 17 percent of fatally injured bicyclists were wearing helmets, 65 percent were not and helmet use was unknown for the remaining 18 percent. A large number of fatally injured bicyclists had blood alcohol concentration (BAC) of 0.08 percent or higher, the legal definition of alcohol-impaired driving, including 28 percent of those aged 16 and older. The percentage of bicyclists with high BACs ranged from 23 percent to 33 percent during the period 1982 to 2012.

Sports injuries

Basketball was the most dangerous sport in 2014, with 522,817 injuries reported followed by biking, with 502,104 injuries and football, with 396,457 injuries.

The National Safety Council reports that there were 179,188 swimming injuries treated in emergency rooms in 2014. About 42 percent of the injuries involved children between the ages of five and 14. A report by the Consumer Product Safety Commission found that 174 children between the ages of one and 14 drowned from Memorial Day to Labor Day in 2014. There has been growing concern about the risks of sports-related concussions as lawsuits filed by injured professional football players have generated national headlines. The problem also affects thousands of young people who engage in a variety of sports. The Centers for Disease Control and Prevention reports that in 2009, an estimated 248,418 children (age 19 or younger) were treated in U.S. emergency departments for sports and recreation-related injuries that included a diagnosis of concussion or traumatic brain injury.

Watercraft accidents

Federal law requires owners of recreational boats and watercraft (non-commercial) to register them. In 2016 there were 11.9 million registered recreational watercraft, about the same number as in 2015. A recreational boating accident must be reported to the U.S. Coast Guard if a person dies or is injured and requires medical treatment beyond first aid; if damage to the boat or other property exceeds $2,000; if the boat is lost or if a person disappears from the boat. Out of the 4,463 accidents reported in 2016, 684 occurred in Florida. Other states with a high number of accidents were California (386), New York (188), Texas (176) and Maryland (150).

Fatalities increased by 12.0 percent to 701 in 2016 from 626 in 2015. The rate per 100,000 registered watercraft was 5.9, up from 5.3 in 2015. The number of accidents rose in 2016 to 4,463 from 4,158 in 2015, up 7.3 percent. Injuries rose to 2,903 in 2016 from 2,613 in 2015, or 11.1 percent. Property damage totaled $49 million in 2016, up from $42 million in 2015.

The U.S. Coast Guard says that alcohol, combined with typical conditions such as motion, vibration, engine noise, sun, wind and spray can impair a person’s abilities much faster than alcohol consumption on land. Operators with a blood alcohol concentration (BAC) above 0.10 percent are estimated to be more than 10 times more likely to be killed in an accident than watercraft operators with zero BAC. Alcohol was a contributing factor in 350 recreational watercraft accidents in 2016 (7.8 percent of all accidents), accounting for 133 deaths (19.0 percent of all deaths) and 335 injuries (11.5 percent of all injuries). Other primary contributing factors were operator inexperience, resulting in 62 deaths; and operator inattention accounting for 45 deaths.


Filed Under: News, Uncategorized

Cyberattack & Small Business Risk

March 11, 2018 By Anna Brantley

Courtesy of iii.org
More than half of U.S. small- and medium-sized businesses (SMBs) experienced a cyberattack within the past year, yet only 14 percent of businesses felt prepared and protected, according to a recent white paper from the Insurance Information Institute (I.I.I.).

The white paper, Protecting Against #Cyberfail: Small Business and Cyber Insurance, examines how insurers are addressing the threat cyberattacks and data breaches pose to SMBs through a combination of innovative insurance products, risk management techniques and employee training.

“Insurers foresee substantial growth coming from the SMB segment, as these companies become aware of the possibilities of liability, especially a breach and resulting response costs arising out of the possession of private data,” said Sean Kevelighan, chief executive officer, I.I.I.

The vast majority of cyber insurance claims involved the loss, exposure, or misuse of sensitive personal data. About half (48 percent) of the data breaches of U.S. small businesses in 2016 were caused by either a negligent employee or contractor, according to the Ponemon Institute.
U.S. insurers reported collecting $1.35 billion in direct premiums written for cyber insurance in 2016, according to the National Association of Insurance Commissioners. Stand-alone cyber insurance policies accounted for $921 million of that total (68 percent), while the balance came primarily from endorsements on either a small commercial or businessowners policy (BOP).

Typical cyber-related policies cover the costs arising from either a cyberattack or a data breach, such as responding to lawsuits, repairing damaged infrastructure, and paying the ‘ransom’ demanded by cyber extortionists, among other potential exposures, such as business interruption expenses.

“Creating an affordable product that SMBs will be willing to buy is a key component in the insurance offering. Since different industry sectors represent different levels of exposure, pricing will vary depending on the type of SMB,” the white paper, co-authored by James Lynch, the I.I.I.’s chief actuary, and the I.I.I.’s Claire Wilkinson, a consultant, states.

The I.I.I. has a full library of educational videos on its YouTube Channel.

Filed Under: News, Uncategorized

Identify Theft Report

February 4, 2018 By Anna Brantley

Courtesy of iii.org

The scope of identity theft

The 2017 Identity Fraud Study, released by Javelin Strategy & Research, found that $16 billion was stolen from 15.4 million U.S. consumers in 2016, compared with $15.3 billion and 13.1 million victims a year earlier. In the past six years identity thieves have stolen over $107 billion.

Following the introduction of microchip equipped credit cards in 2015 in the United States, which make the cards difficult to counterfeit, criminals focused on new account fraud. New account fraud occurs when a thief opens a credit card or other financial account using a victim’s name and other stolen personal information.

Identity theft and fraud complaints

The Consumer Sentinel Network, maintained by the Federal Trade Commission (FTC), tracks consumer fraud and identity theft complaints that have been filed with federal, state and local law enforcement agencies and private organizations. Of the 3.1 million complaints received in 2016, 1.3 million were fraud-related, costing consumers over $744 million. The median amount consumers paid in these cases was $450. Within the fraud category, debt collection complaints were the most reported and ranked first among all 30 types of complaints identified by the FTC. They accounted for 28 percent of all the complaints reported to the FTC and 66 percent of all fraud complaints. In 2016 thirteen percent of all complaints were related to identity theft. Identity theft complaints were the third most reported to the FTC and had increased by more than 47 percent from 2013 to 2015 but fell about 19 percent from 2015 to 2016.

Identity Theft And Fraud Complaints, 2013-2016 (1)

Cybercrime

As businesses increasingly depend on electronic data and computer networks to conduct their daily operations, growing pools of personal and financial information are being transferred and stored online. This can leave individuals exposed to privacy violations, and financial institutions and other businesses exposed to potentially enormous liability if and when a breach in data security occurs.

Interest in cyber insurance and risk continues to grow as a result of high-profile data breaches and awareness of the almost endless range of exposure businesses face. A 2016 data leak, called the Panama Papers in the media, exposed millions of documents from the electronic files of Panamanian law firm Mossack Fonseka. In 2015, two health insurers, Anthem and Premera Blue Cross, were breached, exposing the data of 79 million and 11 million customers, respectively. The U.S. government has also been the target of hackers. Recent breaches at the Federal Deposit Insurance Corp. and the Internal Revenue Service follow multiple breaches in May 2015 of the Office of Personnel Management and the Department of the Interior where the records of 22 million current and former U.S. government employees were compromised.

Cyberattacks and breaches have grown in frequency, and losses are on the rise. Breaches hit a new record in 2016, soaring to 1,093, up from 780 on 2015, but the number of records exposed fell to about 37 million from 169 million in 2015. The majority of the data breaches in 2016 affected the business sector, with 494 breaches or 45.2 percent of the total number of breaches. Medical/healthcare organizations were affected by 377 breaches (34.5 percent of total breaches) while the education sector sustained 98 breaches (9.0 percent of all breaches) and government/military breaches totaled 72 (6.6 percent), according to the Identity Theft Resource Center.

The Center says there have been 1,339 breaches in 2017 so far (as of December 27), surpassing the 2016 record of 1,093 breaches. There were 174 million records exposed so far in 2017. The business sector accounted for 51 percent of the 2017 breaches and 91 percent of records exposed. These figures do not include the many attacks that go unreported. In addition, many attacks go undetected.

In 2014 McAfee and the Center for Strategic and International Studies (CSIS) estimated annual global losses from cybercrime fall between $375 billion and $575 billion. The costs of cybercrime are growing. An annual study of U.S. companies by the Ponemon Institute cites estimated average costs at $15 million in 2015, up 21 percent from $12.7 million in 2014. These costs ranged among the 58 organizations surveyed from a low of $1.9 million to a high of $65 million each year per company. Cyber insurance evolved as a product in the United States in the mid- to late-1990s as insurers have had to expand coverage for a risk that is rapidly shifting in scope and nature. More than 60 carriers offer stand-alone policies in a market encompassing $2.75 billion in gross written premiums in 2015. By mid-2016 gross premiums written was estimated at $3.25 billion.

Filed Under: News, Uncategorized

  • 1
  • 2
  • 3
  • …
  • 7
  • Next Page »

The Griffin Insurance Agency
2139 NE 2nd Street
Ocala, FL 34470

Phone: (352) 732-7105
Fax: (352) 732-9705
Hours: Monday-Friday: 9-5

  • Request a Certificate
  • Payments
  • Claims
  • Insurance Blog
  • Contact Us
  • Home
  • Privacy Policy

Copyright Grffin Insurance Agency 2015 · designed by iWebResults